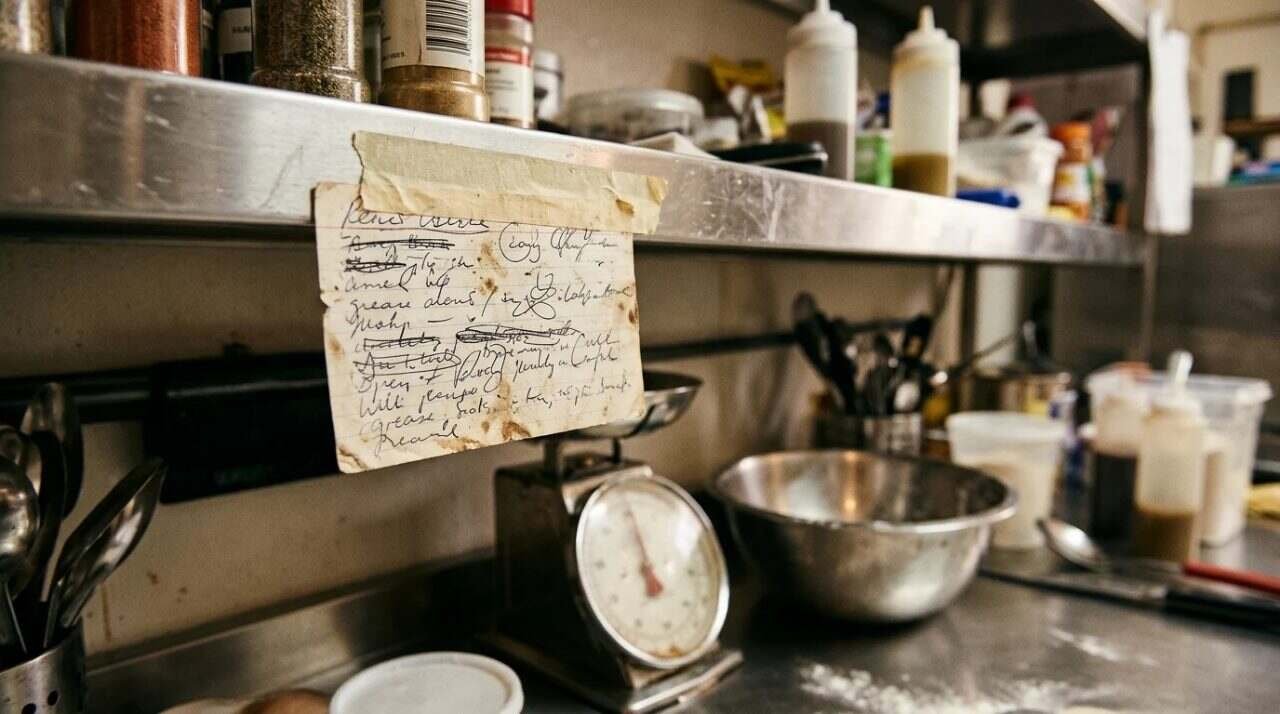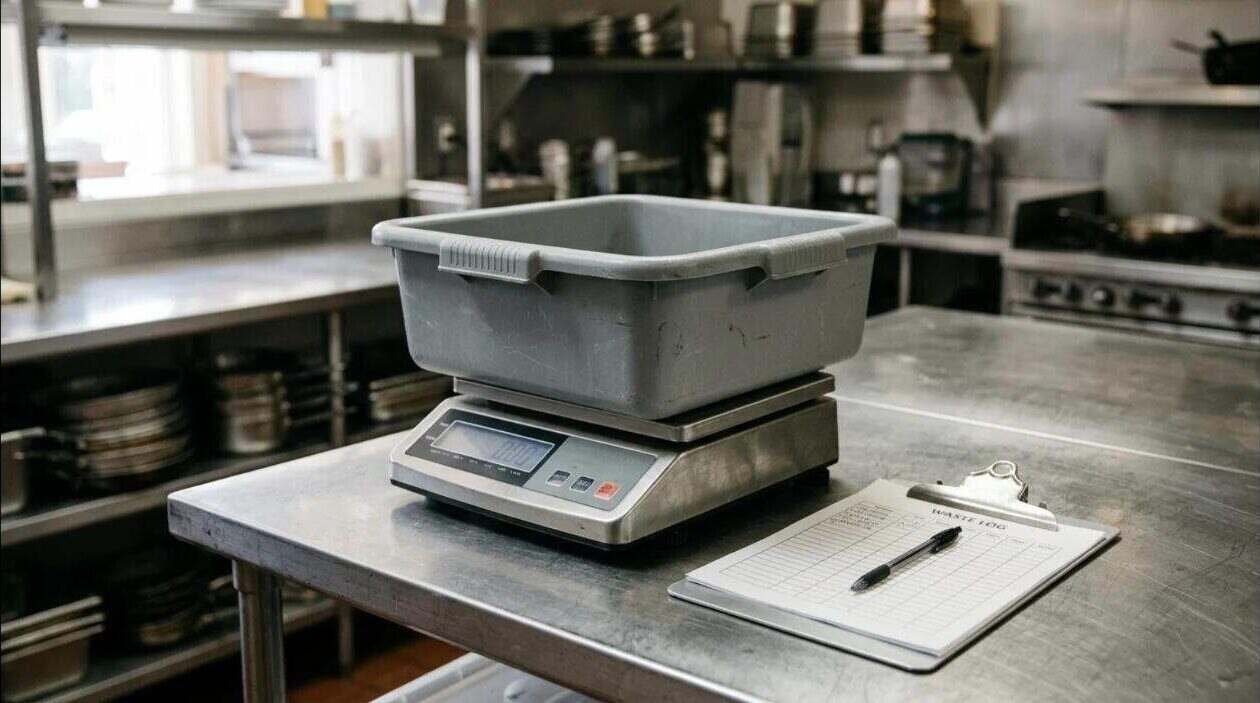
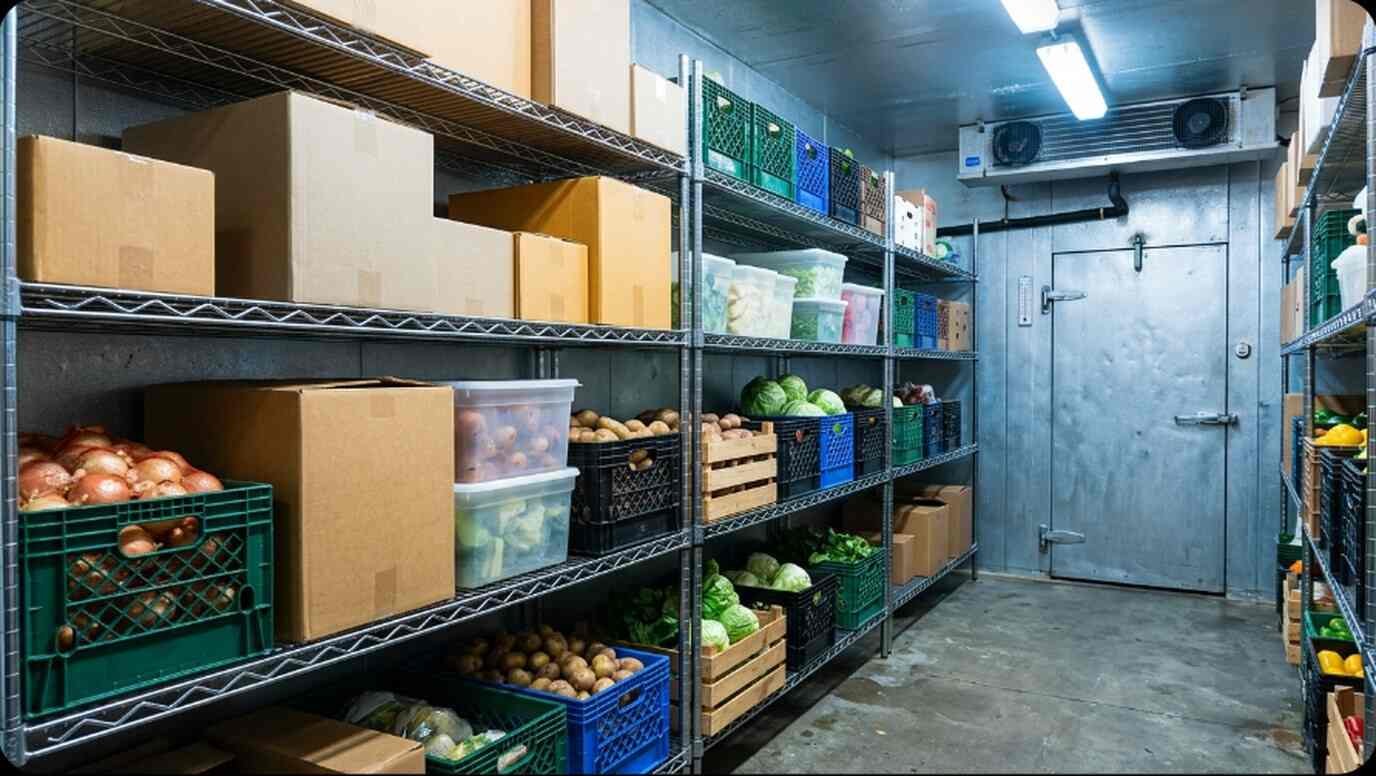
A weekly order guide is a single sheet that lists every item a kitchen buys from one vendor, the amount that should be on the shelf, and the amount actually there. The difference is the order. A free order guide template in Excel and a printable PDF version are available from Till Post, and the rest of this post covers how to fill one in.
What an order guide does
Most kitchens order from memory or from a glance at the walk-in. That works until the person who carries the numbers in their head is out sick. A written guide moves the knowledge onto paper, so any manager can place the same order and get the same shelf.
The guide also forces the count. Typing an on-hand number next to every item takes ten minutes and surfaces what a glance misses: the case of lemons shoved behind the milk, the third box of foil nobody opened.
How par levels work
Par is the amount to have on hand right after a delivery arrives. It is set by how fast an item sells and how often the vendor delivers. A kitchen that gets deliveries twice a week carries less than one that gets a single drop.
The order quantity is par minus what is on hand, never below zero. A par of 6 cases with 2 counted means an order of 4. The template does that subtraction automatically, so the person counting only enters two numbers per line.
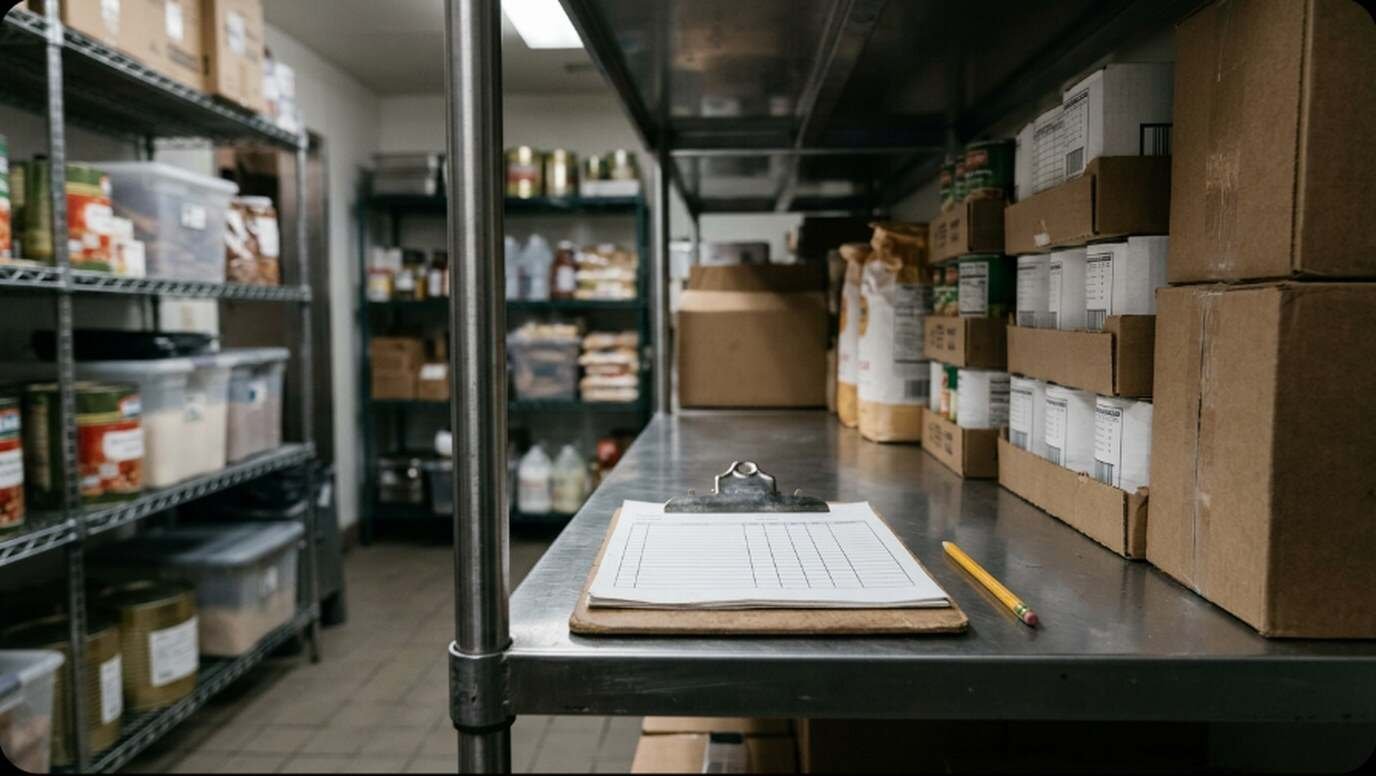
What the spreadsheet contains
The Excel file holds one sheet with room for 40 items. Each line has these columns:
- Item and unit or pack size
- Par level and on-hand count
- Order quantity, calculated from the two numbers before it
- Price per unit and line total, also calculated
- A notes column for substitutions, brand preferences or a rep’s name
At the top are cells for the vendor and the week. At the bottom, an order total adds the line totals. One sheet per vendor keeps the guides short enough to use during a busy morning, and the PDF version prints on a single page for a clipboard.
Setting the first par levels
The first pass is a guess, and that is acceptable. Start with the amounts that were on the shelf after the last few deliveries, then adjust. If the cooler ran out by Saturday lunch two weeks in a row, the par was too low. If product is being thrown out, it was too high.
Reviewing the guide against the sales report shows which items move with weekend volume and which stay flat. The post on reading a restaurant sales report covers where those numbers come from in a point-of-sale system.

Prices and the weekly total
Entering the price per unit turns the guide into a purchasing budget. The order total at the bottom is a number the owner can compare with the week’s food cost target before the truck is booked rather than after the invoice lands.
Prices drift. Keeping the price column current also catches a vendor increase early, which matters because food cost is calculated from those same numbers. The walkthrough on how to calculate food cost percentage shows the arithmetic, and the food cost and menu price calculator converts a changed price into a menu price.
Keeping the guide current
A guide goes stale in a month if nobody edits it. New items get added the day they are first ordered, and discontinued items are deleted the day the vendor says so. Some kitchens keep a dated copy of each week’s filled-in sheet, which gives a record of what was ordered and when.
When a delivery arrives, the guide pairs with a receiving checklist. The receiving checklist template covers that step, and the full set of free sheets sits on the restaurant templates page. The DiCarlo Distributors profile shows what one Long Island vendor offers and how its ordering works.
Downloads
Both files are free to copy and adapt for any business.