Wasted food is easy to see and hard to measure. The bin fills, the hauler comes, and the only record is a purchasing total that never says what went in the trash. The U.S. Environmental Protection Agency’s guide for restaurants calls tracking “the first step” in cutting waste, and the method it describes is plain: weigh what is thrown out, write down what it was and why, and read the pattern a week later.
This post covers what a kitchen waste log records, how the EPA’s paper log sets up the weighing, how the guide sorts waste by cause, how to read the results, and what New York’s food donation and scraps law asks of larger generators. The tracking material comes from the EPA and the legal material from the state Department of Environmental Conservation (DEC). Figures from those sources are quoted with their dates and context, because none of them was measured in a single independent restaurant.
What a food waste log records
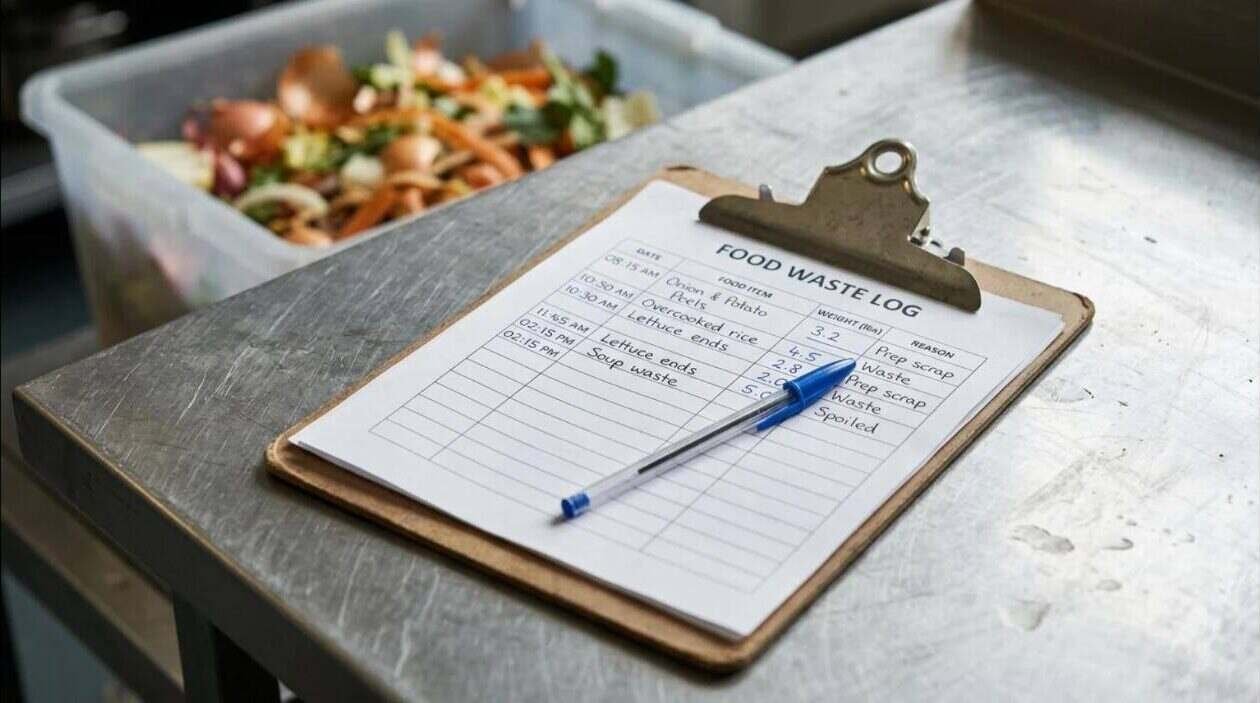
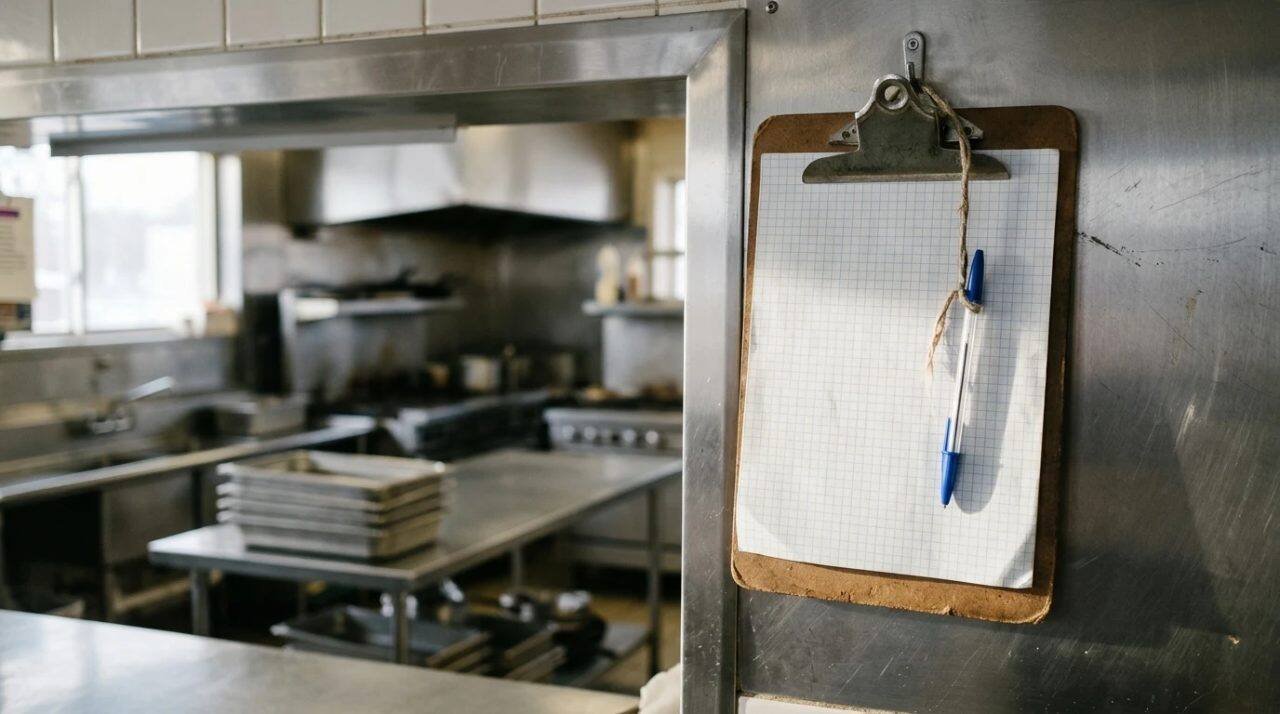
The EPA lists a Paper Tracking Waste Log among its resources for assessing wasted food, on a page last updated in December 2025. The log is a one-page table. Its header holds the facility name, the date, the weather and a line for special events, so an odd total can later be matched to a cause such as a storm or a banquet.
Each row records a single discard: the time, who recorded it, the type of food, the reason it was thrown out, and the amount. The amount can be entered as portions, quarts or pounds, and the log asks for one method to be chosen and used consistently. A totals row closes the table. The log itself credits LeanPath, a company that sells automated waste tracking.
The loss reason is the column that matters most. According to the log’s instructions, recording the food type and the reason for discarding it reveals the most about where a kitchen can improve. A pound of wilted greens and a pound of returned entrées both show up on the scale, but they point to different problems and different fixes.
Setting up a weighing station
The log divides waste into two groups. Pre-consumer waste, meaning everything discarded in the kitchen before food reaches a guest, is logged daily. Post-consumer waste, meaning what comes back from the dining room, is tracked about once a month. Both groups use the same table.
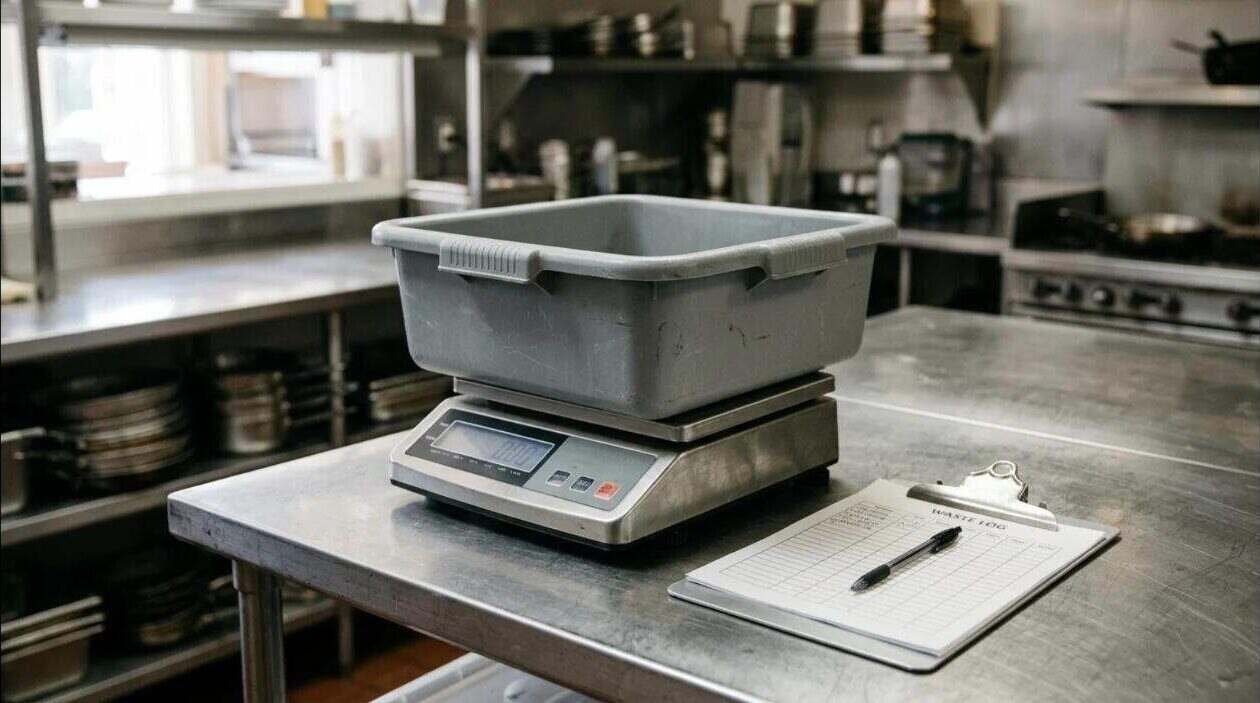
For pre-consumer waste, the instructions call for logging each item at the moment it is discarded, just before it goes into the trash, the compost or the disposer. Food leaving as a donation is logged just before it goes to the food bank or the donation holding area. The preferred way to measure is to weigh the discards in an empty bus tub and record the gross weight; a manager later subtracts the tub’s tare weight to get the net figure. Where there is no scale, the log accepts a count of portions or an estimate of volume.
That setup puts one requirement on the equipment: the scale has to hold the tub and its contents, so its capacity limit matters more than its precision. One product that fits the job on paper is the Escali M-Series NSF Certified Digital Kitchen & Industrial Scale, 66 lb Capacity, Dual Display, Spill-Proof, Stainless Steel. Its Amazon listing describes a sealed, spill-proof display, front and rear screens, a tare function and a 30 kg (66 lb) capacity weighing in 2 g steps.
- Escali M-Series NSF Certified Digital Kitchen & Industrial Scale, 66 lb Capacity: a heavy-duty scale with a sealed display, tare and a 66 lb limit, enough for a loaded bus tub. See it on Amazon (affiliate link)
As an Amazon Associate I earn from qualifying purchases. A commission may be earned if you buy through this link, at no extra cost to you.
The EPA’s restaurant guide names three ways to track: its own Food and Packaging Waste Prevention Tool, which turns paper logs into spreadsheet graphs and summaries, plain paper logs, and automated systems that pair software with hardware. The paper log is free, but the guide notes it takes effort to find patterns in the entries.
Sorting waste by where it came from
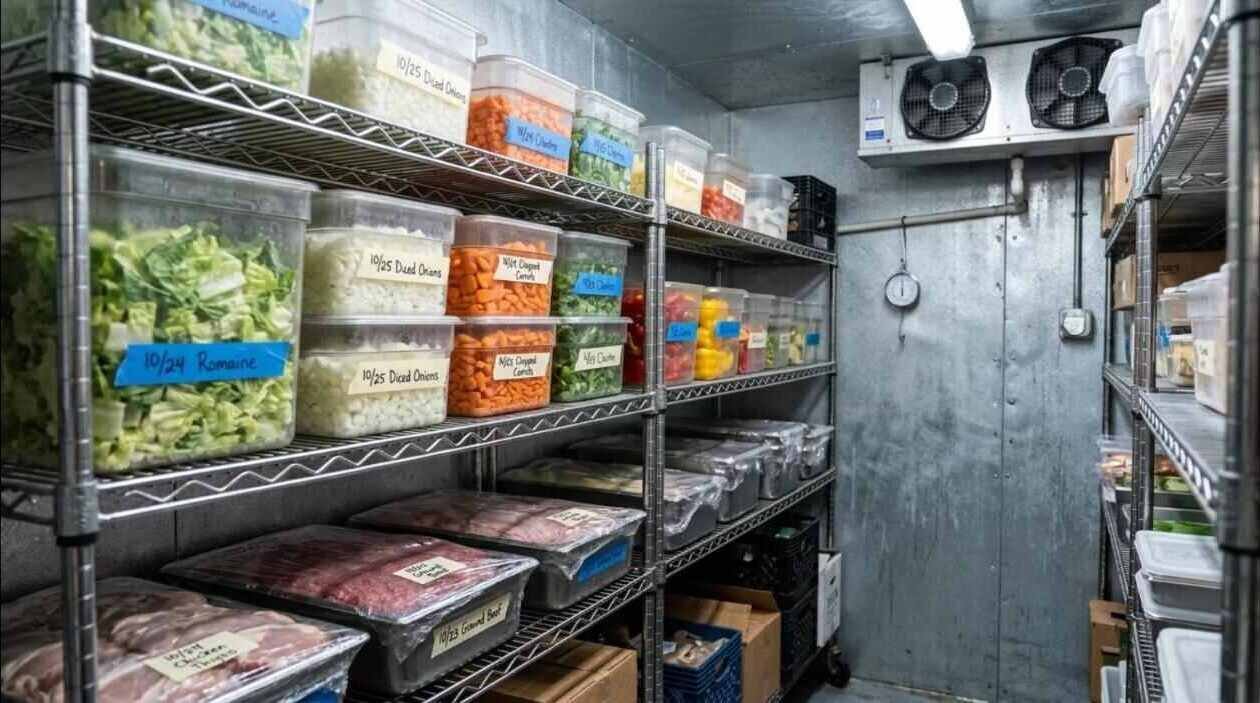
The guide splits the kitchen’s side of the ledger into five causes: prep waste, improperly cooked food, stored food that expired, food that arrived spoiled, and food sent back by customers. A separate area covers packaging, and a third covers plate waste from the dining room. The tool it describes has four steps: enter the general information, collect the day’s discards on paper, enter the data, and analyze the results.
Each category belongs to a different part of the operation. Spoiled arrivals trace to receiving and the supplier, and Till Post’s post on what to check before signing for a delivery covers that checkpoint. Expired stored food traces to ordering and rotation, which the weekly order guide is built to control. Prep waste and overcooked batches trace to the kitchen’s production plan, the subject of the post on a weekly prep list. Returned food points to the menu or the plate.
The guide does not list overproduction as its own category, though it names over-preparation as a cause of waste that could have been avoided. A kitchen that wants to see overproduction separately can enter it in the free-text reason column of the EPA log.
Reading the log
The log’s instructions describe a short routine for the results. Managers and chefs review the previous day’s log at the start of the next shift. The top five wasted items go to the pre-shift meeting, where staff are asked for ideas on reducing them. The same five-item review repeats weekly until the amounts decline. A spreadsheet of daily totals is optional, and so is an automated system.
Post-consumer waste gets lighter treatment, because tracking specific foods and reasons from the dining room is impractical. The instructions suggest recording the total trash weight or a standard count such as cans or bags, measuring on the busiest day, and repeating the measurement on the same weekday so the numbers can be compared. Inspecting what comes back can show trends such as disliked menu items or portions that need adjusting.
The restaurant guide gives two worked examples of what a week of entries can show. In the first, 33 pounds of stored protein expired and 16 pounds of produce arrived spoiled, and the suggested response was to order less protein and to get fresher produce from the supplier or switch suppliers. In the second, chicken dishes accounted for 25 pounds of food sent back, and the suggestion was to change the menu or the portions or to check how the dish was prepared. Those figures illustrate the method; they are not benchmarks for any other kitchen.
What the figures can and cannot show
The guide ties tracking to cost. Savings come from lower purchasing, labor and disposal costs, and possibly from tax deductions for food donations. It points to a free Food Waste Management Cost Calculator for estimating the savings from each option. The purchase side of the same arithmetic is covered in the post on calculating food cost percentage, and a waste log supplies the discard numbers that sit behind a food cost that runs higher than the recipes predict.
The guide also repeats two industry figures, each with a citation. Citing LeanPath, it says food service operations throw away 4 to 10 percent of purchased food before it reaches the plate. Citing a 2010 study by Bloom, it puts the cost of wasted food to the commercial food service industry at roughly $100 billion a year. Both are second-hand estimates from the guide’s footnotes, and neither describes a particular restaurant.
The case studies in the guide come from institutions, not independent restaurants. At the Intel cafés in Hillsboro, Oregon, kitchen waste fell 47 percent and food cost per meal dropped 13.2 percent over a year of tracking and reuse. At the University of Texas at Austin, a later plate audit showed a 48 percent reduction in wasted food after guest education and portion changes. Results at a cafeteria with a captive audience and a central kitchen may not carry over to a 60-seat restaurant, which is a reason to treat the first month of a log as a baseline, not a verdict.
Dates matter here as well. The EPA lists the restaurant guide and the one-time assessment guide as dated March 2014, so the numbers inside them are more than a decade old.
Where the waste goes after it is weighed
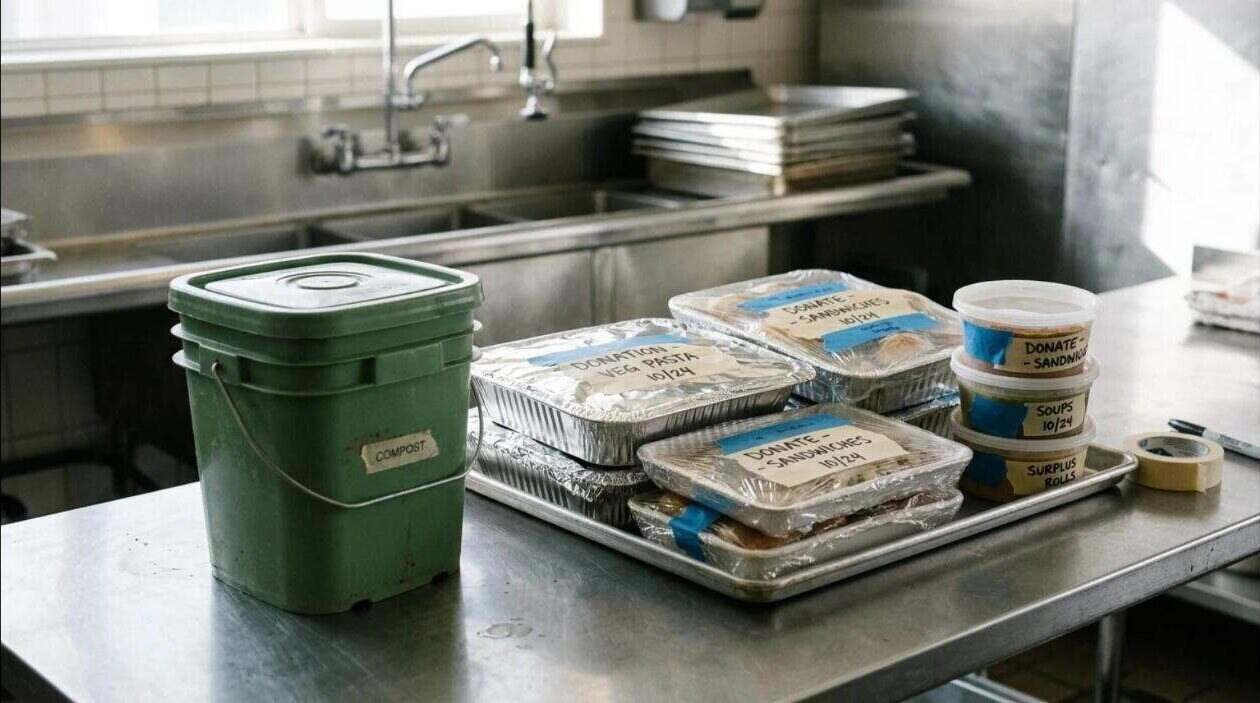
The log records what was thrown out; what happens to it next is a separate decision. The EPA’s Wasted Food Scale, updated in September 2026, ranks the options from most to least preferred. Preventing waste comes first, because it avoids the resources spent producing and preparing the food. Donation of wholesome food ranks second, followed by upcycling and animal feed, then anaerobic digestion and composting. Landfill, incineration and the drain are among the least preferred, and the page says wasted food accounts for 58 percent of landfill methane emissions.
In New York, the Food Donation and Food Scraps Recycling Law turns part of that ranking into a requirement for large generators. Businesses and institutions that generate an annual average of two tons of wasted food per week or more must donate excess edible food “to the maximum extent practicable,” and must recycle the remaining scraps if an organics recycler, such as a composting facility or an anaerobic digester, is within 25 miles.
The thresholds are scheduled to fall. On January 1, 2027, the trigger drops to one ton per week and the distance condition widens to 50 miles. On January 1, 2029, it drops to half a ton per week. One ton is 2,000 pounds, so a kitchen whose weekly log totals approach that range is the kind of operation the 2027 change reaches. The DEC page lists exemptions for New York City, which has its own local law, and for hospitals, nursing homes, adult care facilities and K-12 schools, and it describes a one-year waiver petition for covered entities.
What counts toward the total is defined by the DEC, not by this post. The agency’s guidance handbook, updated in July 2026, is the document to read before concluding that a particular kitchen is covered or exempt, and a licensed attorney can answer for a specific business. A running weekly total from a waste log is the record that makes that question answerable.
For informational purposes only — consult a licensed attorney or financial advisor.
Sources
- Resources for Assessing Wasted Food, U.S. EPA
- Waste Logbook, U.S. EPA archive
- Reducing Wasted Food & Packaging: A Guide for Food Services and Restaurants, U.S. EPA Region 9
- Wasted Food Scale, U.S. EPA
- Food Donation And Food Scraps Recycling Law, New York State DEC
- Escali M-Series NSF Certified Digital Kitchen & Industrial Scale, Amazon (affiliate link)
- Kitchen Waste Audit Training, Housing and Dining Sustainability Advocates, YouTube