The fish fry sells out every Friday by eight o’clock, eighty plates at $14.95, and on paper it loses about twenty-eight dollars a night. The numbers in this post are invented for the arithmetic, not taken from any restaurant’s books, but the shape is common enough: a dish that moves fast, looks like a hit from the pass, and quietly costs the house money once every cost that touches the plate gets a line of its own.
Till Post has already covered the formulas in Restaurant Menu Pricing Without Guessing, the counting in How to Calculate Food Cost Percentage, and the single-dish worksheet in How to Write a Recipe Costing Card. This one starts from the other end, with a dish that already has a price and a following, and asks what that price is doing.
The fish fry, line by line
Eighty plates, five cost lines, one small loss. The invented Friday special breaks down like this, worked out per plate:
- Menu price: $14.95
- Plate cost (cod, batter, fries, slaw, tartar, lemon, fryer oil): $6.20, a food cost of 41.5 percent
- An extra fry cook for six hours at $20 an hour, spread across 80 plates: $1.50
- A share of the regular line’s wages: $1.60
- Overhead, at $18,000 a month across 3,000 covers: $6.00
Total cost per plate comes to $15.30. Each fish fry loses 35 cents, and eighty of them lose $28 a night, which over a year of Fridays is a modest used fryer that nobody gets to keep.
Moving the price to $16.95 drops the food cost to 36.6 percent and turns the same eighty plates into about $132 of profit on the night, assuming the same eighty people still order it. Pricing the plate to a 30 percent food cost would put it at $20.67. That number is arithmetic. Whether the Friday regulars follow the fish from $14.95 to $20.67 is a different question, and no formula answers it.
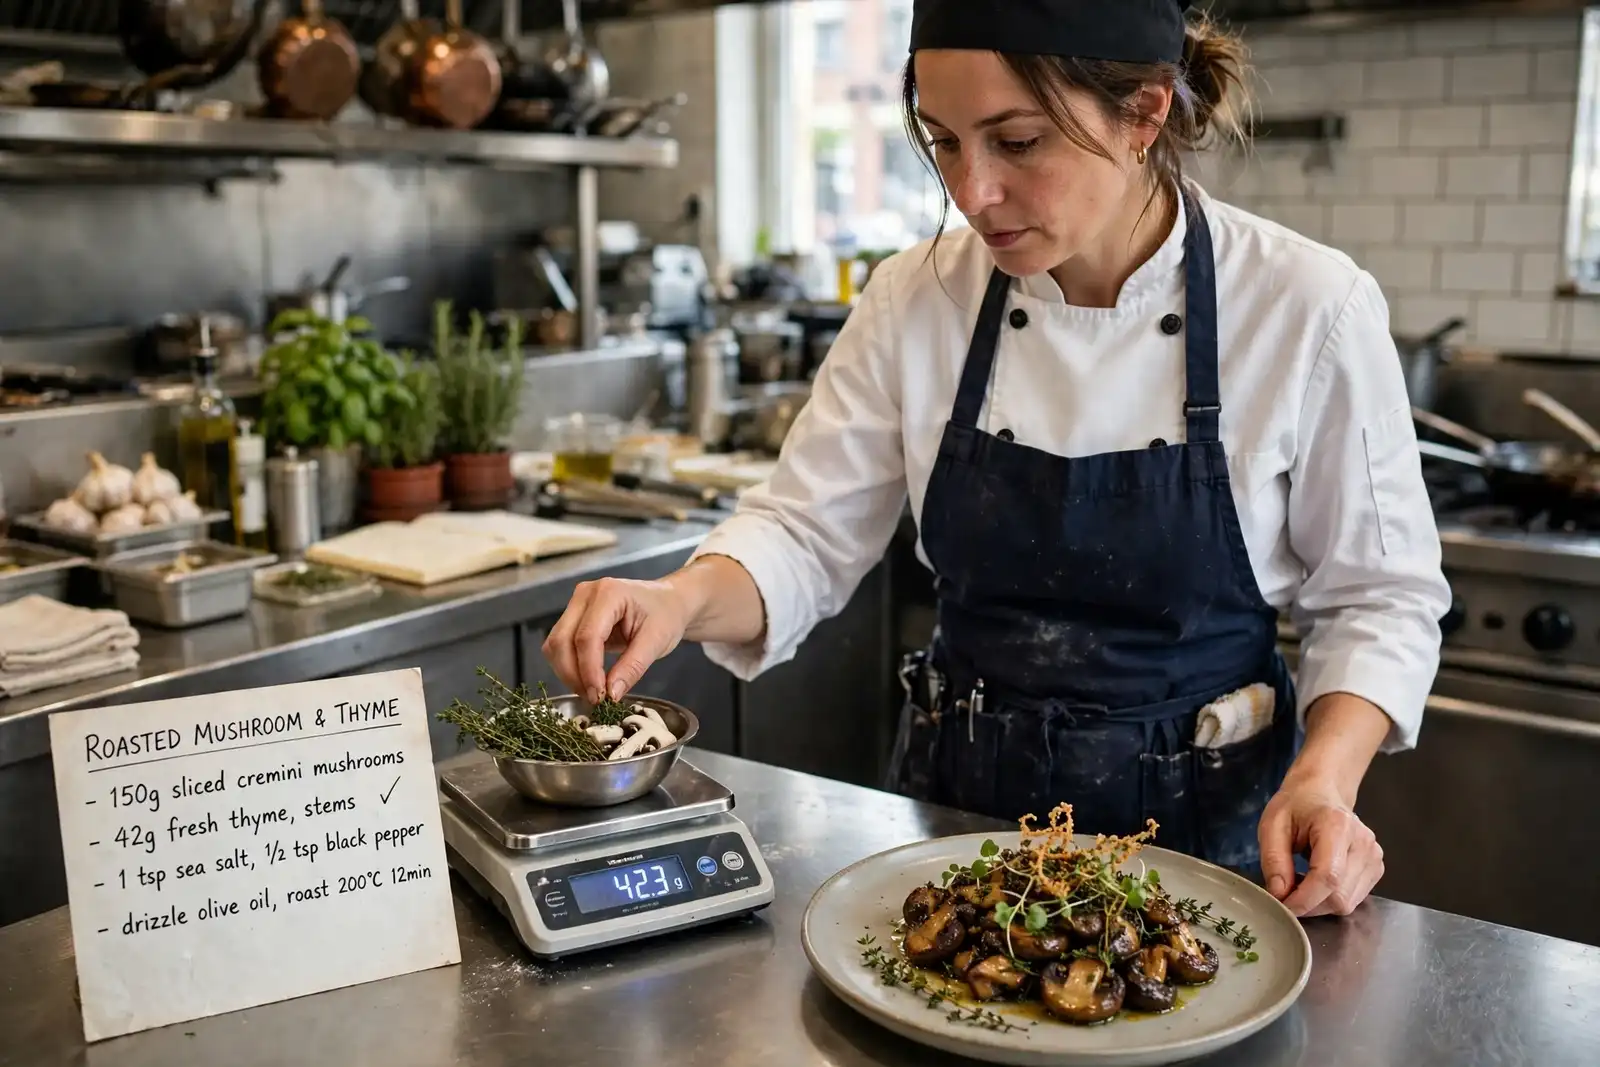
Plate cost starts with yield, not with the invoice
A pound of raw protein is not a pound on the plate. RestaurantMargin’s food cost formula guide defines plate cost as the cost of every ingredient on the plate, “accounting for trim, waste, and cooking yield,” and tells operators to use their own tested trim and cooking yields for proteins. Its illustration is a 10-ounce raw chicken breast that cooks down to 7.5 ounces. A plate that needs 6 ounces cooked therefore needs about 8 ounces raw, and the invoice price per pound has to be applied to the eight, not the six.
Batter, breading and fryer oil behave the same way. They never appear as a single neat purchase per plate, so they tend to get rounded to zero, and a fish fry is mostly batter and oil by the time it leaves the basket. The small lines are where a plate cost goes soft. The recipe card post covers how to write them down so they stay written down.
For a benchmark, UpMenu’s guide to food cost percentage, updated in October 2026, reports National Restaurant Association medians for 2024 food and non-alcoholic beverage cost: 32.0 percent of sales for full-service restaurants overall and 33.7 percent for full-service restaurants with sales under $2 million. The guide notes that the NRA presents those figures as benchmarks, not targets. The invented fish fry, at 41.5 percent, sits well above either median. That would usually be the end of the analysis. It shouldn’t be.
Where the food cost percentage misleads
A good percentage and a good dish are different things. Michael L. Kasavana, professor emeritus at Michigan State University, wrote in a 2025 essay for the American Hotel & Lodging Educational Institute: “Perhaps the oldest misconception in food service management is that food cost is directly related to profitability.” The same essay defines contribution margin as the menu price minus the item’s direct cost, the dollars a plate leaves behind after the food is paid for.
Two invented plates make the point. A $15 pasta with $3.75 in ingredients runs a 25 percent food cost and leaves $11.25. A $28 steak with $11.20 in ingredients runs 40 percent and leaves $16.80. By percentage the pasta is the model citizen and the steak is the problem. By dollars the steak carries $5.55 more toward rent, wages and the electric bill on every sale, and nobody has ever paid a linen bill with a percentage.
A 1995 paper in the FIU Hospitality Review, “Menu Engineering: A Model Including Labor” by Stephen M. LeBruto, William J. Quain and Robert A. Ashley, puts it more bluntly. The menu engineering approach, the authors write, recognizes “that operators deposit cash, not percentages.” They also note one reason the idea spread slowly: managers are often paid on food cost percentage rather than contribution margin, which rewards exactly the wrong instinct when the pasta and the steak sit side by side.
Run the fish fry through the same lens and it gets more interesting, not less. At $14.95 it leaves $8.75 after food, which is not a bad contribution by itself. The plate does not lose money because the food is expensive. It loses money because $8.75 is not enough to cover the cook who was hired for it and a full share of a building that costs the same whether the fryer is on or not.
Labor, the cost the original matrix left out
Contribution margin fixes one blind spot and keeps another. LeBruto and his co-authors observed that “the largest expense in most restaurant operations is labor cost, which is a semi-fixed cost,” and that the standard model “does not consider other variable costs and labor costs.” Their attempt to tie labor to individual items in a school cafeteria ran into a wall: “No relationships between specific menu items and labor could be ascertained.” Their workaround was to tag each item as high or low labor and expand the four-box grid to eight.
That is a modest fix, and an honest one. A hand-breaded fish fry with a dedicated cook is plainly high labor. A soup ladled from a pot made at six in the morning is plainly low. Most plates sit somewhere in the middle, and pretending to know the labor cost of one plate to the penny is the kind of precision that falls apart the first time somebody calls out sick.
Prime cost handles labor at the level of the whole restaurant instead. In a Baker Tilly article from October 2024, consultants Brian Campbell and David Foster define prime cost as cost of goods sold plus labor, measured as a share of total sales. They report that research puts prime cost targets between 58 and 62 percent depending on the type of restaurant, use 60 percent as their working target, and warn that prime cost over 65 percent makes a profit extremely difficult unless volume is high. They add that cost of goods can run 40 percent or more if labor stays around 20 percent or less.
The invented fish fry, counting only its own food and labor, runs a prime cost of about 62 percent. That sits inside the range the consultants describe. It still loses money per plate in this example, because overhead per cover is high and prime cost was never built to judge one dish at a time. A restaurant-wide number and a single-plate number answer different questions, and the labor cost and scheduling post covers how labor gets measured against sales week to week.
Sorting the menu into four piles
The grid is older than most of the POS systems that now draw it. Kasavana writes that menu engineering was developed with Donald I. Smith at the Michigan State University School of Hospitality Business, circa 1982. Every item gets two scores, popularity and contribution margin, and lands in one of four boxes:
- Stars: high profitability and high popularity.
- Plowhorses: low profitability and high popularity.
- Puzzles: high profitability and low popularity.
- Dogs: low profitability and low popularity.
The fish fry is a plowhorse in its purest form, the plate everybody orders and nobody makes money on. Plowhorses are where pricing decisions hurt most, since the dish has a crowd attached. A dog can be cut on a Tuesday and missed by no one. A plowhorse that gets cut or repriced badly takes its regulars with it, and some of those regulars were ordering a drink and a dessert alongside the fish.
Puzzles are the opposite problem: plates that earn well and sit unordered. Placement on the page and the words used to describe them both move orders, and those are covered in How Menu Layout Changes What Customers Order and Writing Menu Descriptions That Sell Without Overpromising. LeBruto’s eight-box version keeps the farm-and-sky naming, and its worksheet ranks a turkey sandwich as a “Shining Star.”
Ideal cost against actual cost
The recipe on paper and the recipe at 7:45 on a Friday are not always the same recipe. UpMenu’s guide separates ideal food cost, also called theoretical food cost, from actual food cost. Ideal cost assumes every plate goes out exactly to spec, and is worked out as the sum of units sold times plate cost, divided by net food sales. Actual cost comes from the inventory count: beginning inventory plus purchases minus ending inventory, divided by net food sales. The gap between them, which the guide calls food cost variance, reflects waste, over-portioning, comps, theft and counting errors.
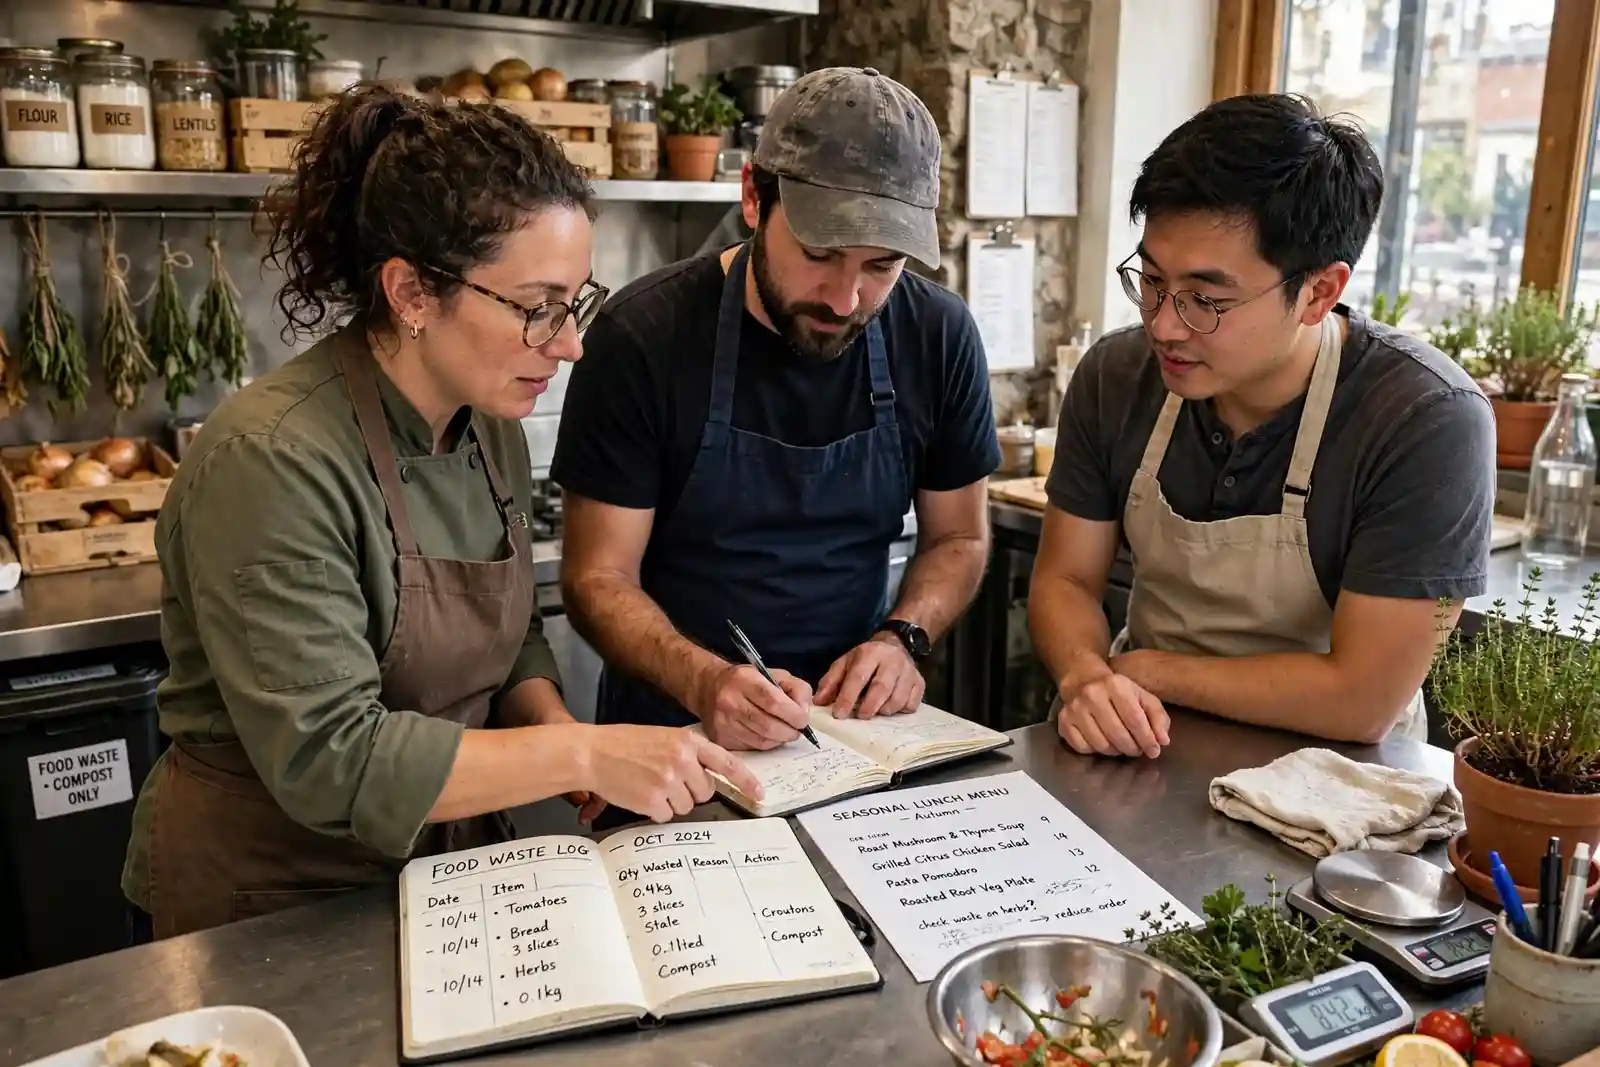
For the fish fry, variance is where the $6.20 plate cost gets tested. A cod portion cut heavy when the line is slammed, or a basket of fries dumped because it sat too long, never shows up on the costing card. It shows up in the count at the end of the month, as a percentage that refuses to match the paper. A two-dollar price increase charged against a plate that is really costing $7 instead of $6.20 fixes less than it appears to, and the post on tracking food waste covers how kitchens find where the difference went.
So the Friday special ends up with three possible fixes and none of them clean: a higher price the regulars may or may not carry, a cheaper plate that may not be the same fish fry anymore, or a cook schedule that bends around the rush instead of standing through it. The kitchen can run the numbers on all three by Monday. Eighty people decide the rest on Friday. Of the three, which one would the regulars at a neighborhood fish fry forgive first?
For informational purposes only — consult a licensed attorney or financial advisor.
Sources
- The Power of Menu Engineering, Part One, Michael L. Kasavana, American Hotel & Lodging Educational Institute (April 8, 2025)
- Menu Engineering: A Model Including Labor, Stephen M. LeBruto, William J. Quain and Robert A. Ashley, FIU Hospitality Review, Vol. 13, No. 1 (1995)
- Not hitting your Prime Cost targets? Tips on ways to reach them!, Brian Campbell and David Foster, Baker Tilly (October 17, 2024)
- How to Calculate Food Cost Percentage (Formula + Benchmarks), Marek Truskolaski, UpMenu (updated October 13, 2026)
- Food Cost Formula for Restaurants, RestaurantMargin (2026)
- How to Determine Menu Price Point | Restaurant Business, Howcast (YouTube)