

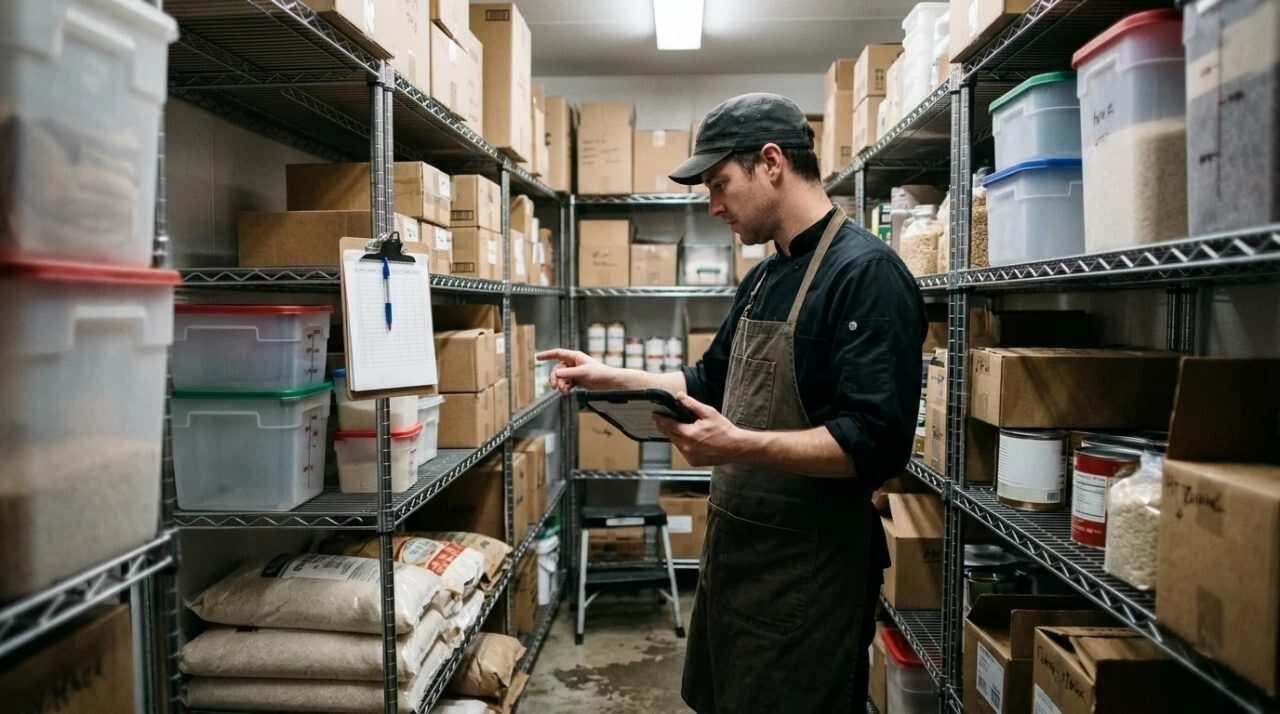
Food cost percentage is the share of your food sales that went to buying the food. A restaurant sells $100 of food, $30 of it was product, and the number is 30%. The arithmetic takes a minute. The trouble is in the counting that feeds it.
I came to this number the way most operators do, by doing it wrong first. Before COVID, the Heritage Diner in Mount Sinai, the family restaurant where I work, tracked food cost by what we purchased. It was a rough estimate and we knew it. Today we track it much better, with Square. This post walks through the formula as published sources give it, the mistake we made, and what a clean count looks like.
The formula

Two published guides give the same three steps. David Scott Peters, writing in FSR magazine, lays them out this way:
- Beginning inventory plus purchases gives the total product you had available.
- Total available minus ending inventory gives what you used.
- What you used, divided by food sales, gives the food cost percentage.
A ChowNow guide gives the same method and a worked example: $13,000 in food cost against $40,000 in food sales is 32.5%.
Here is a version with invented round numbers, so the steps are easy to follow. These are not the diner’s figures.
| Step | Example |
|---|---|
| Beginning inventory (counted on the first day) | $6,000 |
| Purchases during the period (food invoices only) | $9,500 |
| Total available | $15,500 |
| Ending inventory (counted on the last day) | $5,500 |
| Food used | $10,000 |
| Food sales for the same period | $32,000 |
| Food cost percentage | 31.25% |
Both inventory counts matter. Skip one and the answer is wrong.
The mistake we made
We divided what we bought by what we sold. It feels right. Money went out for food, money came in from food, and the ratio looks like the answer.
Peters calls that out directly. In his piece, dividing purchases by sales does not give an accurate food cost, because the timing of orders and the stock on hand distort the result. A big delivery on the 30th makes the month look expensive. A thin week of ordering makes it look cheap, while the shelves quietly empty.
That was our rough estimate. It told us roughly where we stood and missed the thing we most needed to see, which was what the kitchen actually used.
What a clean count includes
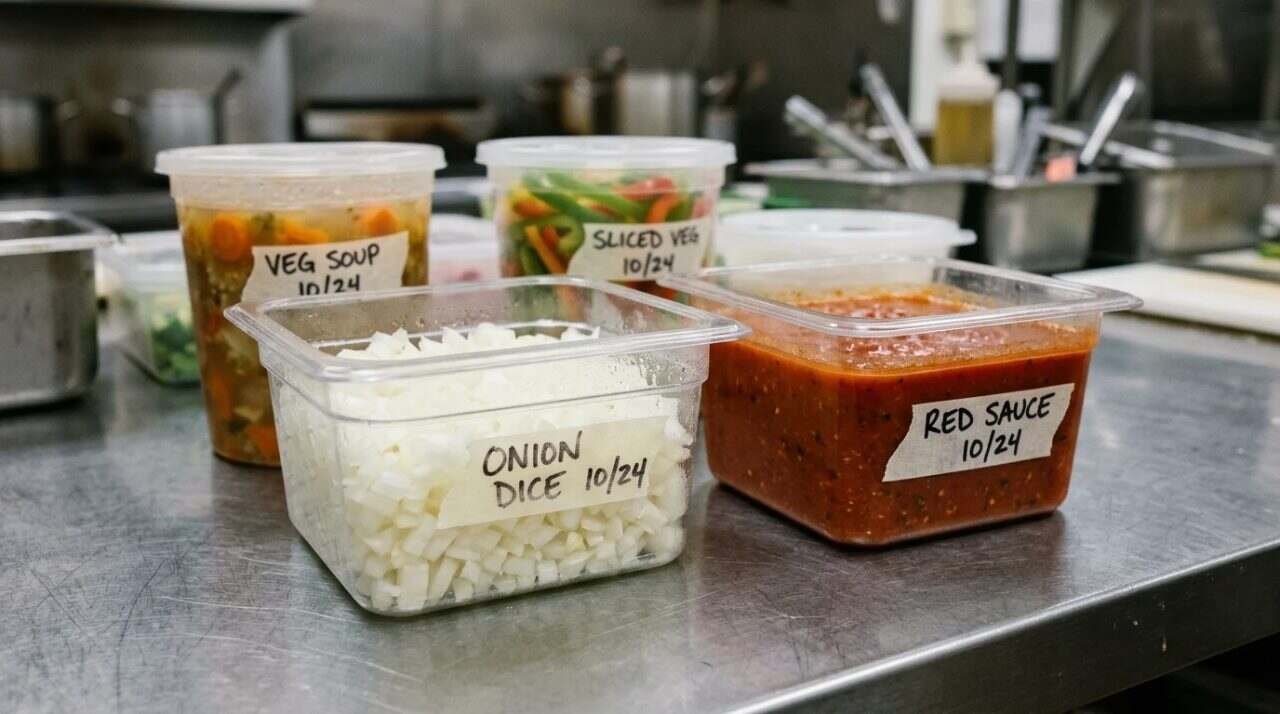
The same article lists the places counts go wrong. Each one has a version in our kitchen.
Prepped food counts as inventory. Diced vegetables, sauces, soups, desserts and other scratch-made components all belong in the count. Peters says leaving them out inflates the food cost, because the product shows as used when it is sitting in a container in the walk-in.
Non-food purchases stay out. Paper goods, janitorial supplies, smallwares and equipment come out of the purchases total before you subtract anything. A restaurant that buys cleaning supplies from the same vendor as its produce has to separate them on the invoice.
Food sales only. The denominator is food sales. Beverage and other sales do not belong in it, which is one reason a point-of-sale system that sorts sales by category helps. A restaurant that sells coffee all morning needs that line kept apart.
Count on a schedule. Peters says to count at the end of a period, ideally weekly, possibly monthly. The figure is only as current as the last count.
What the math cannot tell you
The formula gives you what left the inventory. It does not tell you why. Product leaves because it was sold, spoiled, wasted, over-portioned or stolen, and the percentage treats them all alike. Peters points to recipe costing cards, waste sheets and a tracker for key items as the tools that explain the gap.
ChowNow draws the same line from another side. It recommends comparing theoretical food cost, what the menu says each plate should cost, against actual food cost, what the count says you spent, and checking regularly so small variances get caught early. According to the guide, a percentage above the range may point to higher ingredient costs, inconsistent portions or poor inventory management, while a percentage below it may mean prices are too low or quality is slipping.
That second half is easy to miss. A low number is not automatically good news.
The same week, counted two ways
Here is how far the purchase shortcut can drift, again with invented numbers. Say a restaurant sells $8,000 in food during a week and uses $2,400 of product, which is 30%. That week, a vendor delivers a large order of dry goods and the restaurant buys $4,000 in total. Purchases divided by sales says 50%. The kitchen did nothing different. The shelves are fuller.
The next week, sales are the same and the restaurant buys only $1,200 because it is working through stock. Purchases divided by sales says 15%. Average the two weeks and the figure lands near 32%, which looks fine, but each week on its own told a wrong story and a manager reacting to either one would have made a bad call. A count of what is on the shelves at each end of the week is what keeps the number honest.
Three ways to bring it down
ChowNow groups the fixes under three headings, and each one matches a place a kitchen loses money.
Purchasing. Negotiate with vendors, compare quotes, buy in bulk only when storage and turnover allow it, and use seasonal ingredients.
Portion control. Standardize recipes, use scales and portioning tools, and train staff to follow the specs. A cook who adds a little extra to every plate is spending your margin a spoonful at a time.
Waste. Label and date items, rotate stock first in, first out, match prep to demand and count inventory regularly. The last item loops back to where this post started: counting is both the measurement and the discipline.
What number to aim for
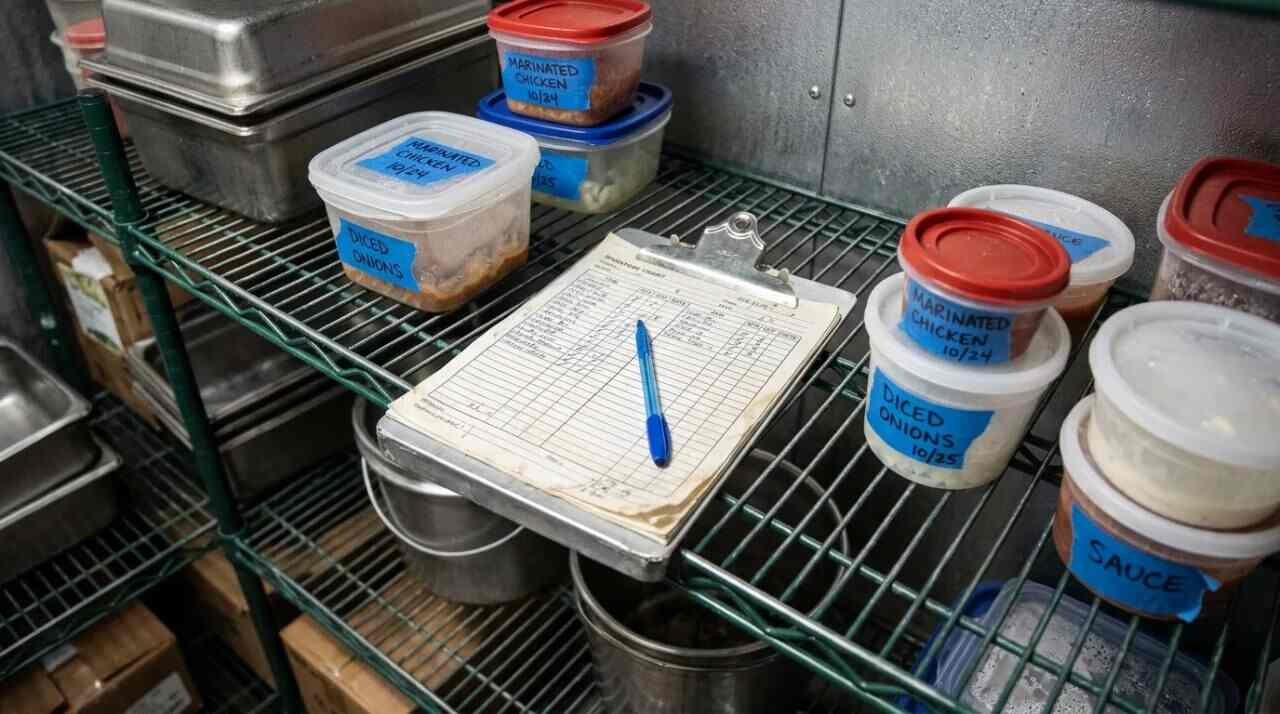
ChowNow’s guide says most restaurants aim for an ideal food cost percentage between 28% and 35%, depending on concept, menu style and pricing strategy. Peters does not give a target in his piece. He says operators need to know where their own number should be to make money, which depends on their budget.
That second answer is the more useful one. A published range tells you where other restaurants land. Your own range comes from your rent, your labor, your prices and what you need left over. I won’t give you the diner’s percentage, and I would not trust one from any restaurant that did not have your menu.
Weekly or monthly
Peters says weekly is ideal and monthly is possible. A monthly count is easier to schedule and slower to warn you. If a walk-in cooler dies on the second of the month, you learn the cost on the thirtieth. A weekly count shrinks that window to days. Restaurants new to counting can start monthly and move to weekly once the first count stops feeling like a project. Either way, count the same time of day on the same day, and use the same shelf order, so the numbers from one period compare cleanly with the next.
Doing the count without a spreadsheet war
Peters argues that spreadsheets are hard to maintain, make it difficult to add new products and can miss items received during the period, and he recommends inventory software that separates the purchases on each invoice. That is one writer’s position, and the underlying point holds for anyone: the system you use has to make the weekly count easy, or the count will not happen.
At the diner, the old figure was a rough estimate built from purchases. Today we track food cost much better, with Square, and the number stopped being a feeling.
A short routine you can start this week
- Pick one day each week and count everything, including prepped items and what is in the walk-in, the reach-ins and dry storage.
- Enter the count the same day, so the previous week’s ending inventory becomes this week’s beginning inventory.
- Sort invoices into food and non-food before you total purchases.
- Pull food sales for the same days from your point-of-sale reports.
- Run the formula and write the percentage next to last week’s.
After a month you will have four numbers. One that jumps is worth a conversation with the kitchen.
For informational purposes only. Figures from published guides are benchmarks, not promises, and your costs depend on your menu, your suppliers and your location. Consult a licensed accountant for your own books.
Sources
- David Scott Peters, FSR magazine, Learn the right way to calculate restaurant food cost: https://www.fsrmagazine.com/feature/learn-right-way-calculate-restaurant-food-cost/
- ChowNow, The Ultimate Guide to Restaurant Food Cost: https://get.chownow.com/blog/guide-to-restaurant-food-cost/
- WISK on YouTube, How To Calculate Your Food Cost Percentage: https://www.youtube.com/watch?v=O5D9ptpy-gI